
Stock Map

Stock Map

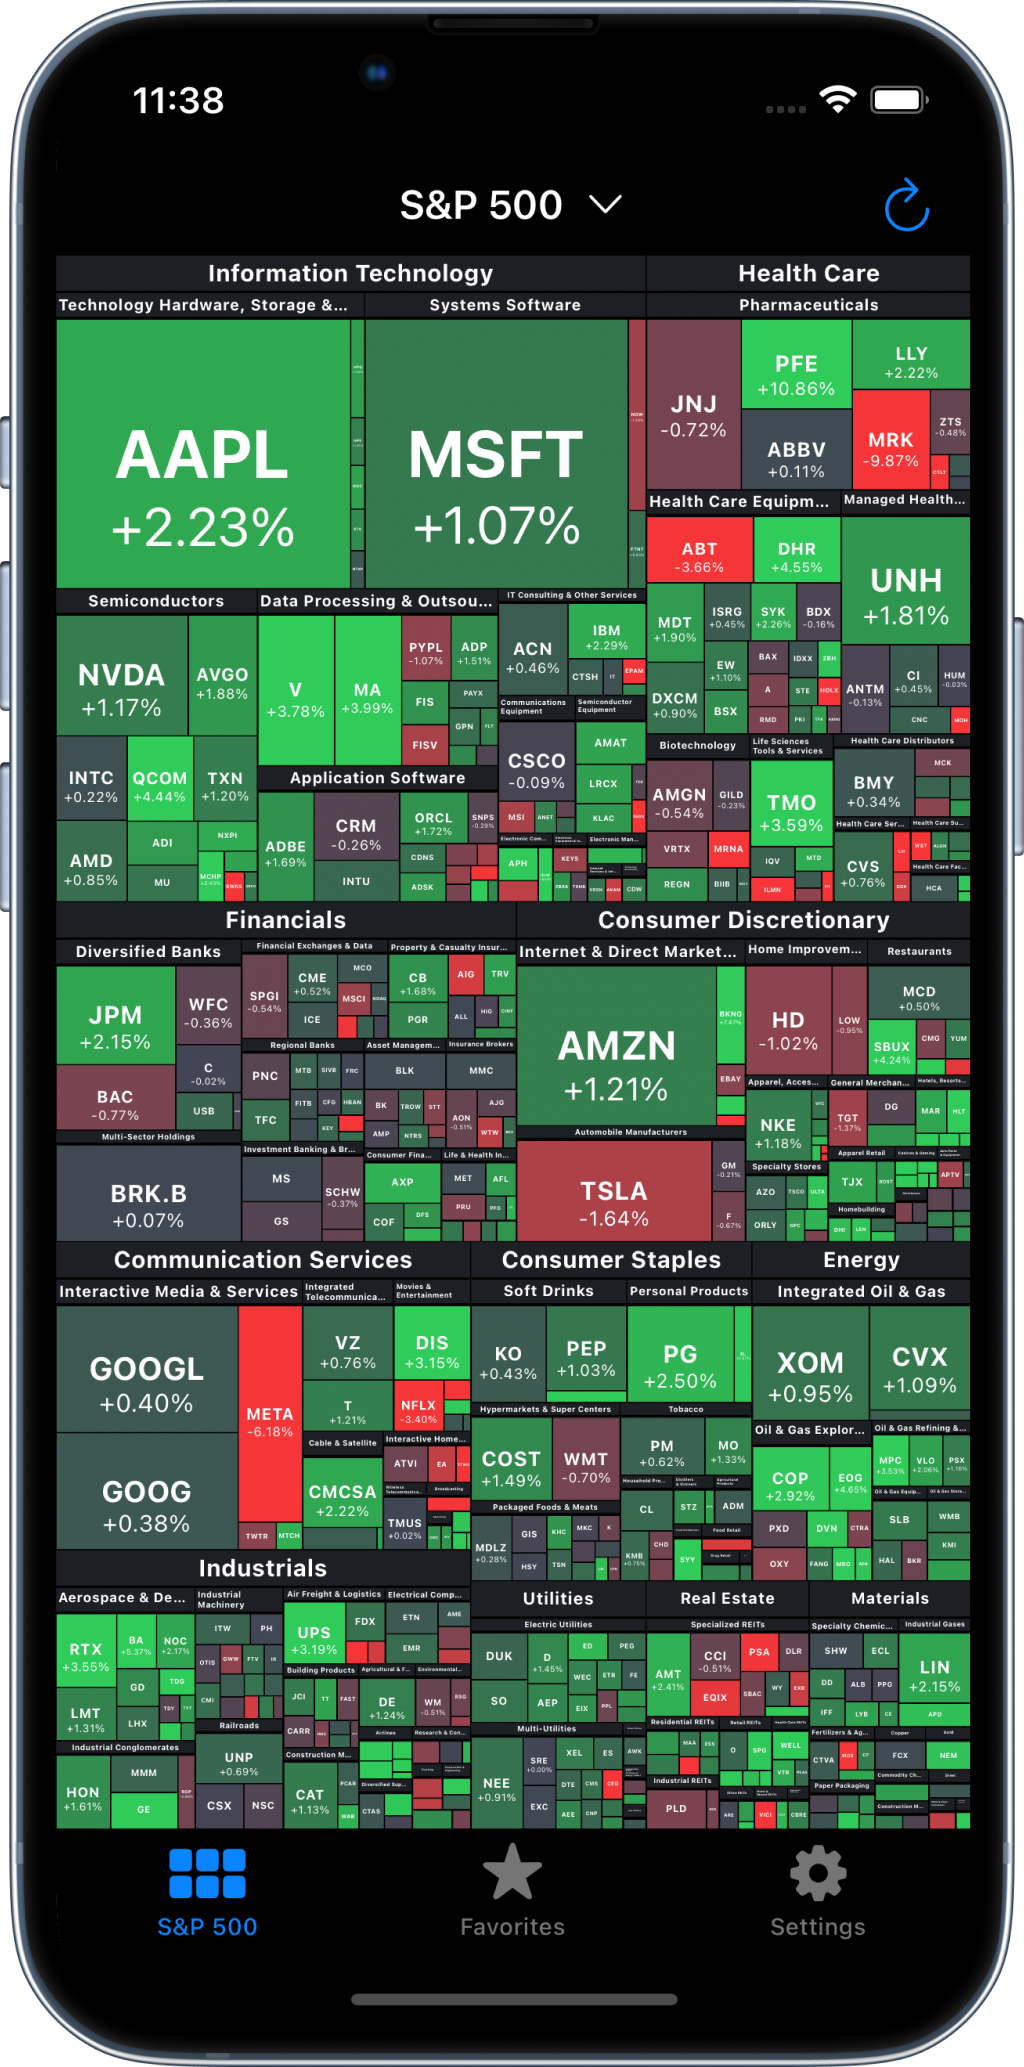
The US stock market at a glance, as a heat map on your iPhone.

S&P 500 · Nasdaq 100 · Dow Jones

Download on the App Store

4.8 out of 5 · 2,758 ratings on the App Store

The Stock Map home screen showing the whole S&P 500 as a heat map, with sectors such as Information Technology and Health Care and tiles for AAPL, MSFT and NVDA

Features

S&P 500, Nasdaq 100 and Dow Jones

Switch between all three US indices by tapping the title at the top of the map.
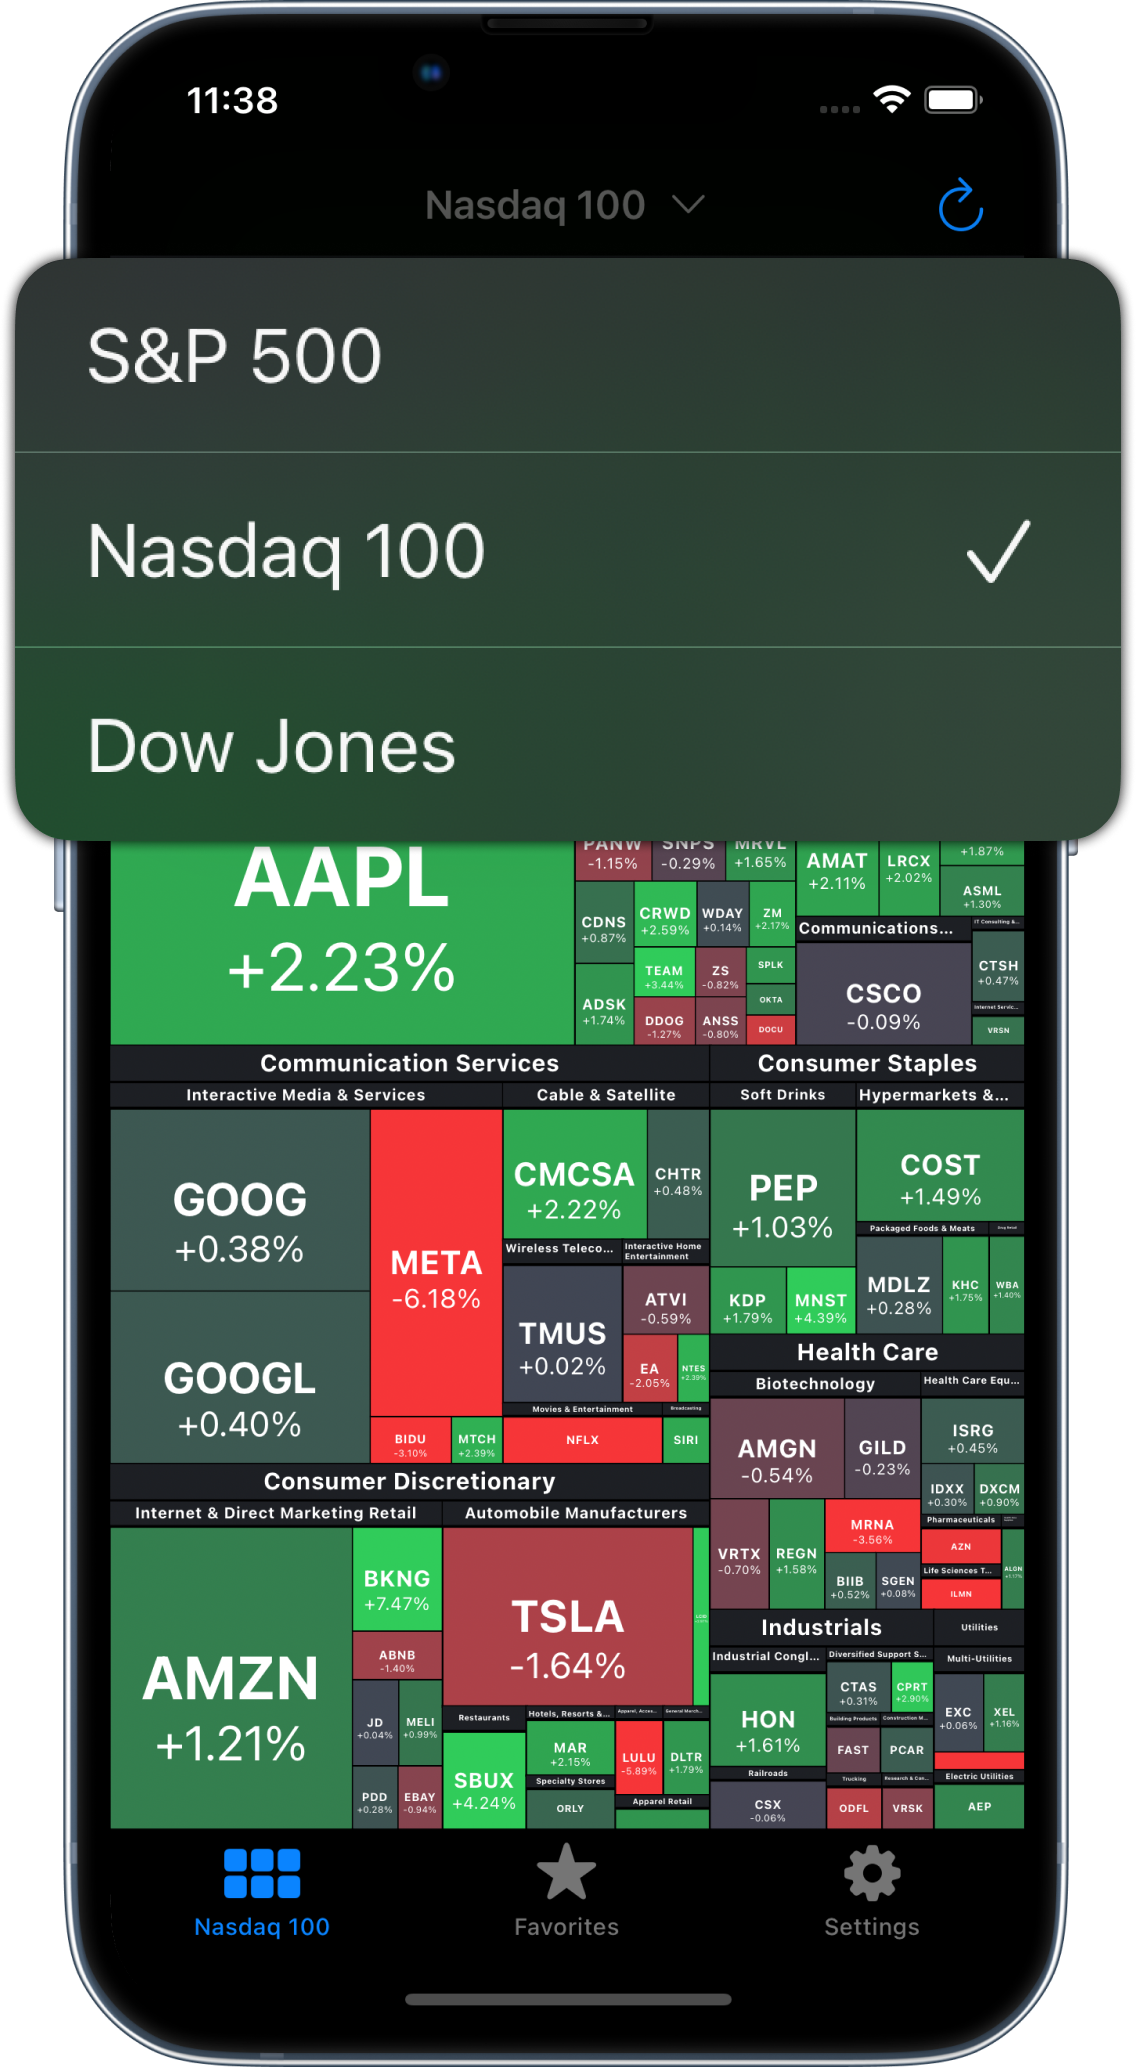
The index picker open over the map, listing S&P 500, Nasdaq 100 and Dow Jones

Multiple time ranges

Track stock performance over timeframes like 1-Day, 1-Week, 1-Month, 3-Month, and 1-Year.
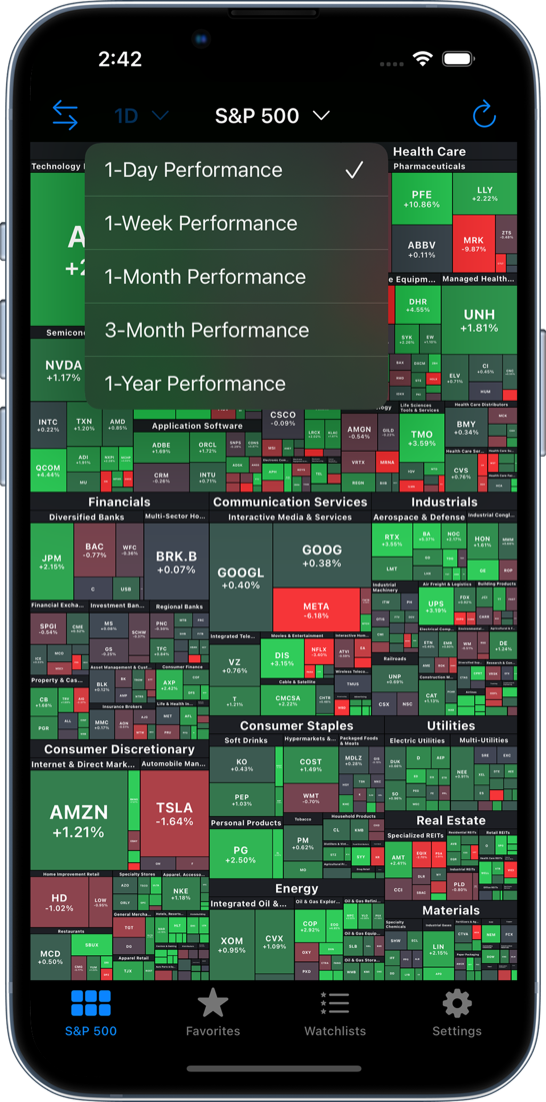
The time range menu open over the map, listing 1-Day, 1-Week, 1-Month, 3-Month and 1-Year performance

Stock map widget

Add a widget to keep an eye on your favorite stocks and favorite sector or industry.

A Stock Map widget on the iPhone home screen showing AAPL, MSFT, AMZN, GOOGL, TSLA and NVDA as coloured tiles

Add stocks to your favorites

Add interesting stocks to your favorites, so you can follow your favorite stocks easily.
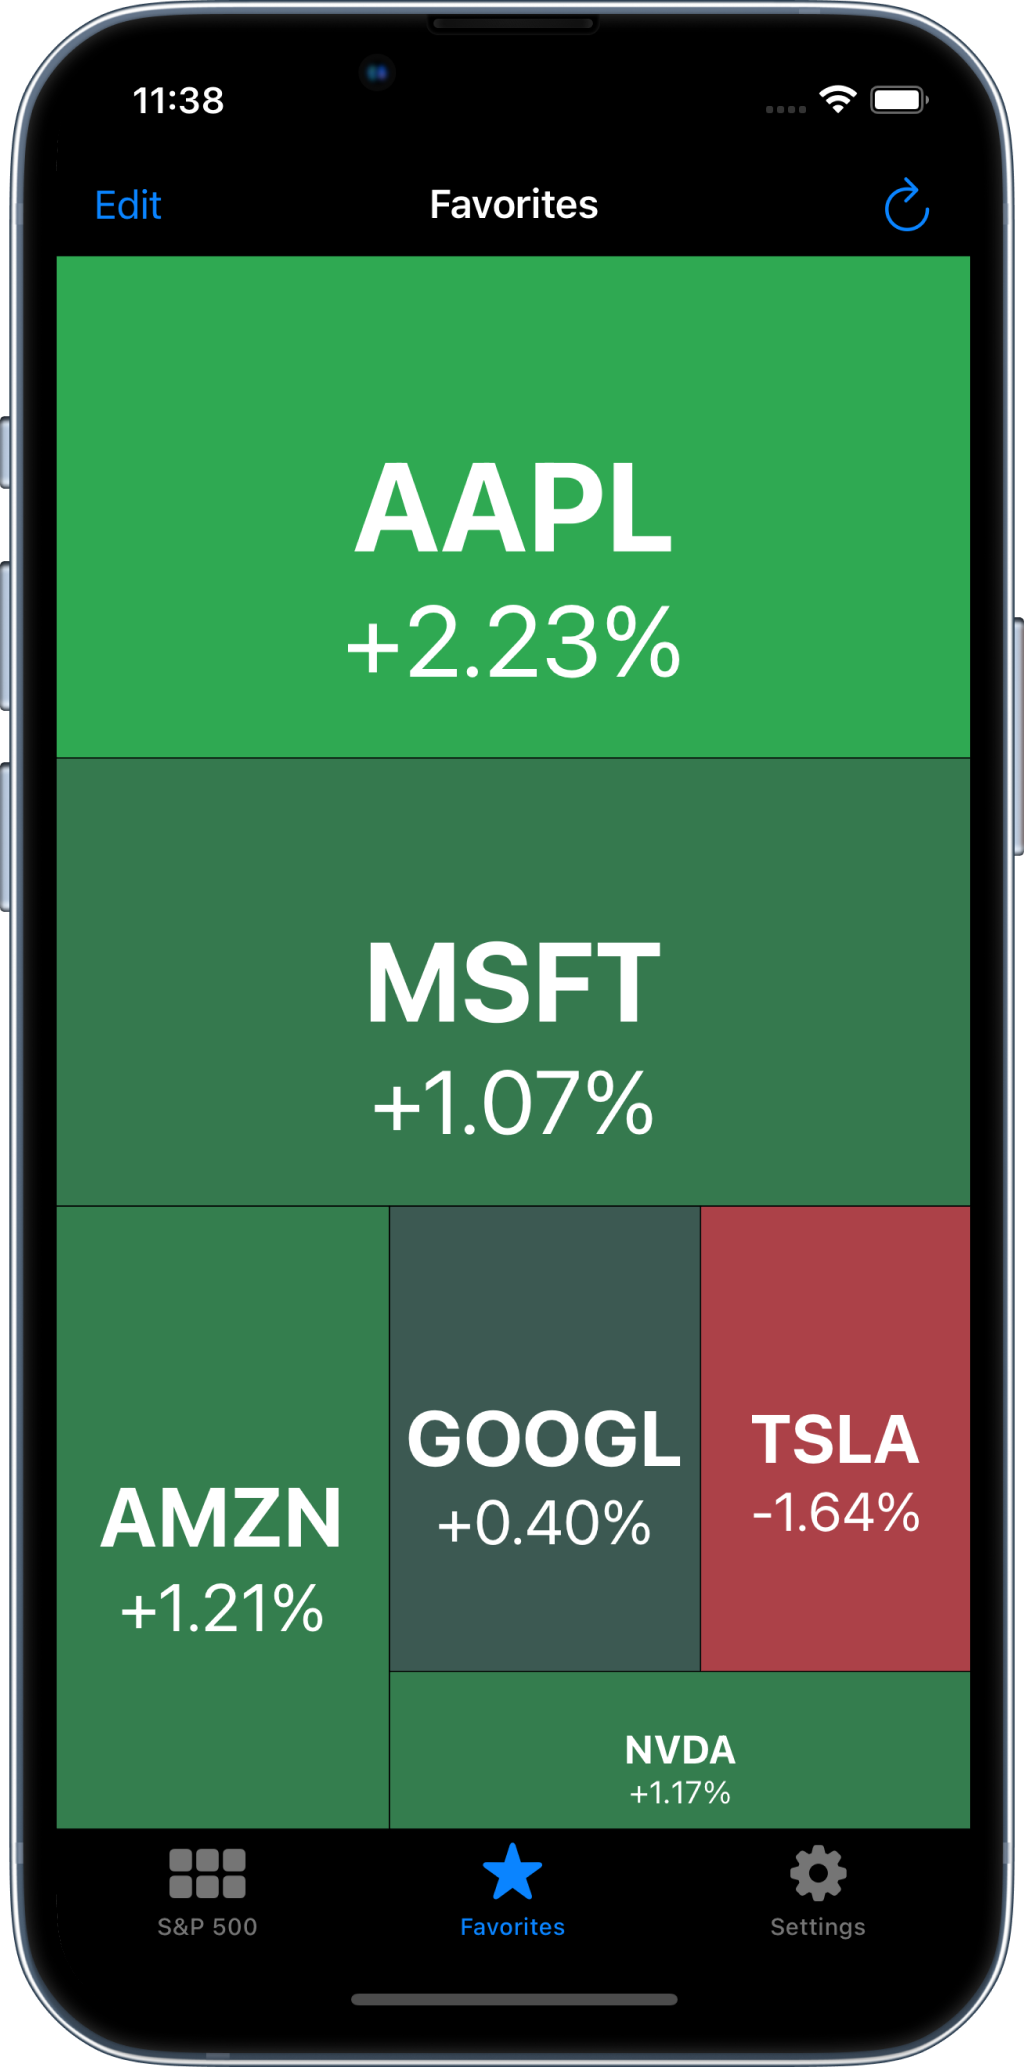
The Favorites tab showing only saved stocks as a heat map: AAPL, MSFT, AMZN, GOOGL, TSLA and NVDA

See specific industries or sectors

Tap any sector or industry in the treemap to see the stocks inside it.
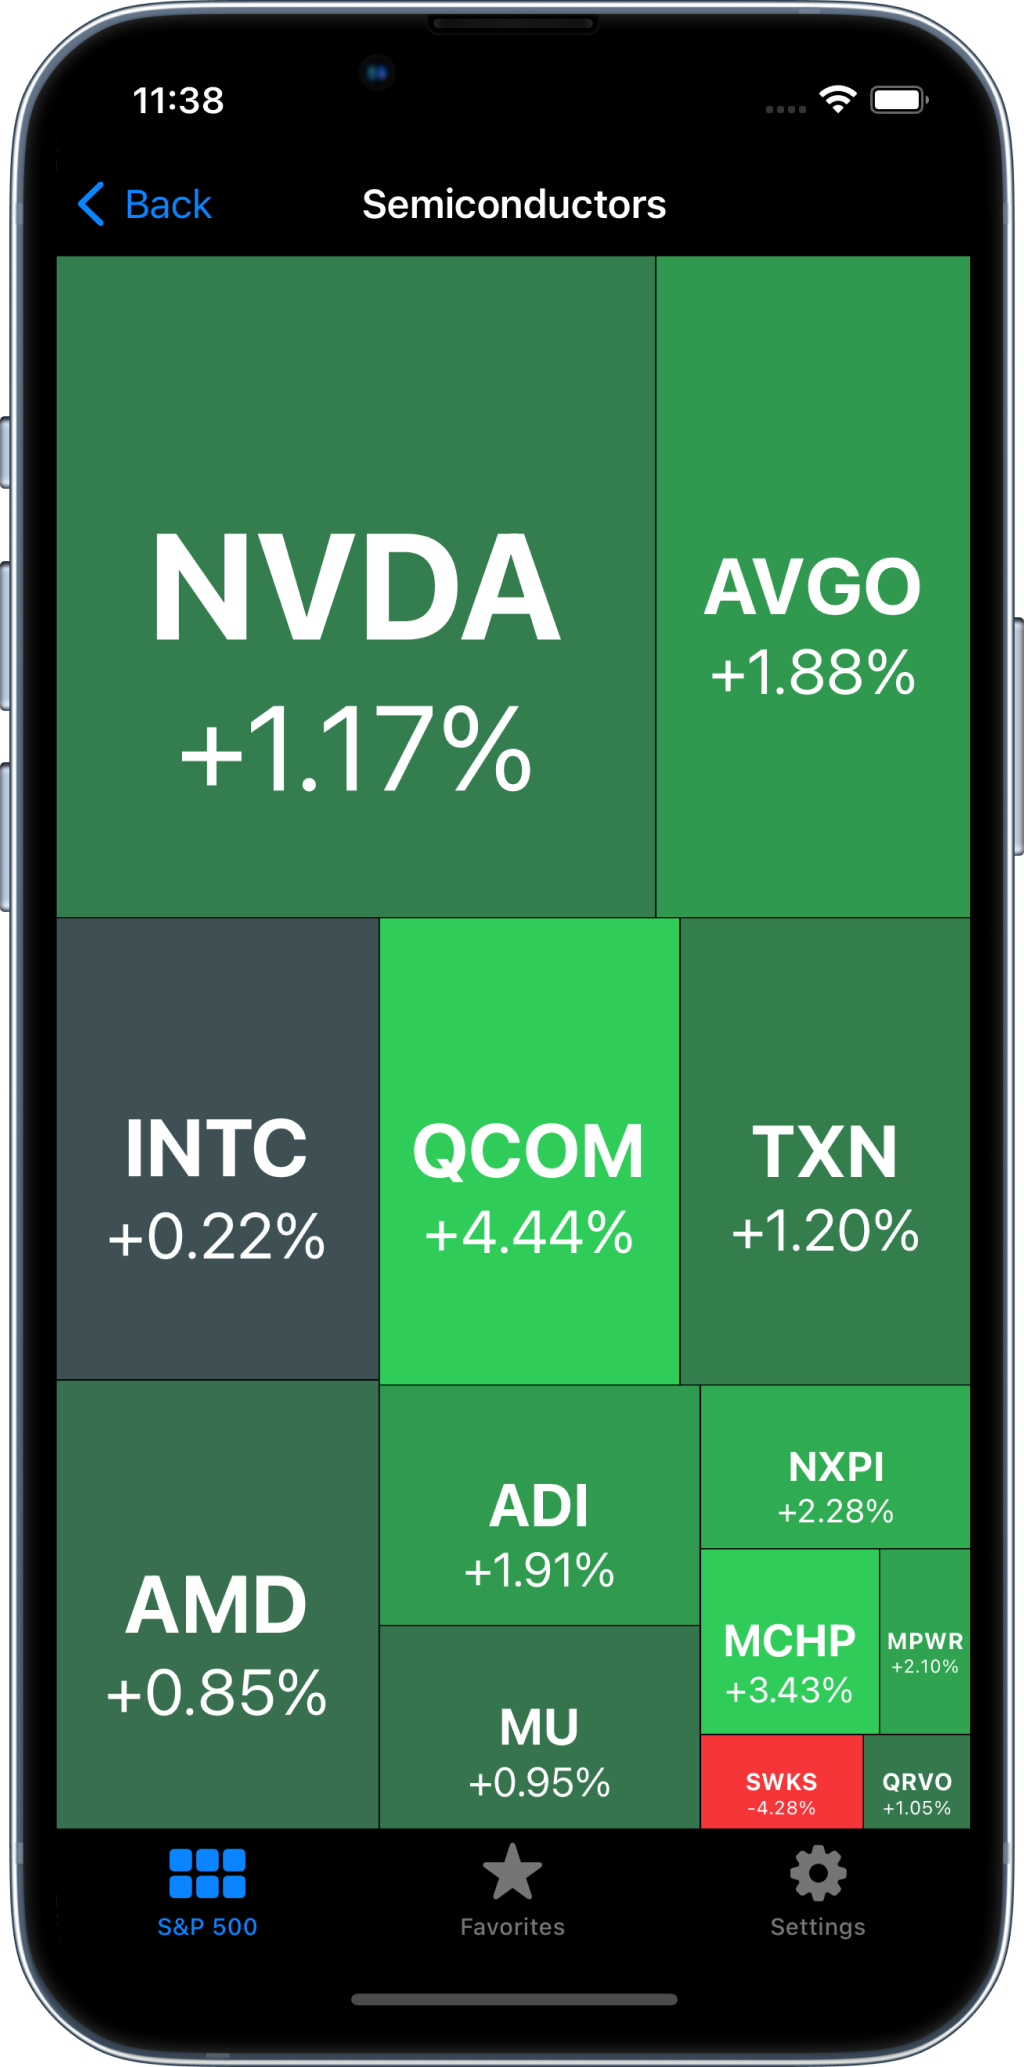
The Semiconductors industry opened on its own, showing NVDA, AVGO, INTC, QCOM, TXN and AMD

Pinch-to-zoom feature

Zoom into any interesting area by pinching on the map.

Ready to get started?

Download on the App Store